


OSWorld 2.0
A benchmark for evaluating computer-use agents on long-horizon, real-world workflows: 108 authentic tasks across 31 self-hosted web environments and professional desktop applications, with partial-credit scoring (avg 27.25 checkpoints per task).


At a glance
108
31
69.6%
>250
27.25
Leaderboard
| Rank | Model | Effort | Approach | Binary | Partial | Est. Cost |
|---|---|---|---|---|---|---|
| 1 | Opus 5 | max | Batch tool |
44.33%
|
77.67%
|
n/a |
| 2 | Opus 5 | high | Batch tool |
36.89%
|
68.92%
|
n/a |
| 3 | Opus 5 | xhigh | Batch tool |
33.33%
|
73.11%
|
n/a |
| 4 | Opus 5 | medium | Batch tool |
33.01%
|
64.85%
|
n/a |
| 5 | Opus 5 | max | Batch tool |
31.43%
|
68.31%
|
n/a |
| 6 | Opus 5 | xhigh | Batch tool |
30.21%
|
67.67%
|
n/a |
| 7 | Opus 5 | high | Batch tool |
28.98%
|
63.79%
|
n/a |
| 8 | GPT-5.6 Sol | max | Batch tool |
27.34%
|
62.72%
|
n/a |
| 9 | Opus 5 | medium | Batch tool |
25.33%
|
60.49%
|
n/a |
| 10 | Opus 5 | low | Batch tool |
22.32%
|
54.89%
|
n/a |
| 11 | Opus 4.8 | max | Batched tool |
20.6%
|
54.8%
|
n/a |
| 12 | Opus 5 | low | Batch tool |
18.81%
|
59.09%
|
n/a |
| 13 | Opus 4.8 | max | Standard |
18.52%
|
49.33%
|
n/a |
| 14 | Opus 4.7 | max | Batched tool |
18.2%
|
48.91%
|
n/a |
| 15 | Opus 4.7 | max | Standard |
13.9%
|
49.1%
|
$3.87K |
| 16 | GPT-5.5 | xhigh | Batch tool |
13%
|
49.5%
|
$2.75K |
| 17 | Sonnet 4.6 | medium | Standard |
9.3%
|
33.9%
|
$1.55K |
| 18 | Sonnet 4.6 | max | Standard |
8.3%
|
41.5%
|
$2.41K |
| 19 | MiniMax M3 | enabled | Standard |
4.6%
|
22.3%
|
$258.78 |
| 20 | Kimi K2.6 | enabled | Standard |
4.6%
|
22.1%
|
$708 |
| 21 | Qwen3 7-Plus | thinking | Standard |
2.8%
|
21.5%
|
$411.56 |
| Rank | Model | Effort | Approach | Binary | Partial | Est. Cost |
|---|---|---|---|---|---|---|
| 1 | GPT-5.5 | xhigh | Batch tool |
13%
|
49.5%
|
$2.75K |
| 2 | Opus 4.7 | max | Standard |
13%
|
39.8%
|
$2.47K |
| 3 | Sonnet 4.6 | medium | Standard |
8.3%
|
29.4%
|
$990 |
| 4 | Sonnet 4.6 | max | Standard |
6.5%
|
35.8%
|
$1.72K |
| 5 | Kimi K2.6 | enabled | Standard |
4.6%
|
14.4%
|
$604 |
| 6 | MiniMax M3 | enabled | Standard |
3.7%
|
16.6%
|
$182.03 |
| 7 | Qwen3 7-Plus | thinking | Standard |
1.9%
|
16.6%
|
$403.33 |
| Rank | Model | Effort | Approach | Binary | Partial | Est. Cost |
|---|---|---|---|---|---|---|
| 1 | GPT-5.5 | xhigh | Batch tool |
13%
|
46.7%
|
$1.88K |
| 2 | Opus 4.7 | max | Standard |
4.6%
|
20.3%
|
$1.03K |
| 3 | Sonnet 4.6 | max | Standard |
4.6%
|
20%
|
$800 |
| 4 | Sonnet 4.6 | medium | Standard |
4.6%
|
14.2%
|
$410 |
| 5 | MiniMax M3 | enabled | Standard |
1.9%
|
8.2%
|
$86.82 |
| 6 | Kimi K2.6 | enabled | Standard |
1.9%
|
7.1%
|
$336 |
Key takeaways
Opus 5 (max effort) leads at 44.33% binary completion and 77.67% partial score — well above the sub-20% ceiling reported in earlier evaluations. Partial scores across the top-ranked configurations now cluster between roughly 55% and 78%, showing frontier agents complete meaningfully more of these long-horizon workflows end-to-end than before.
Trajectory showcase
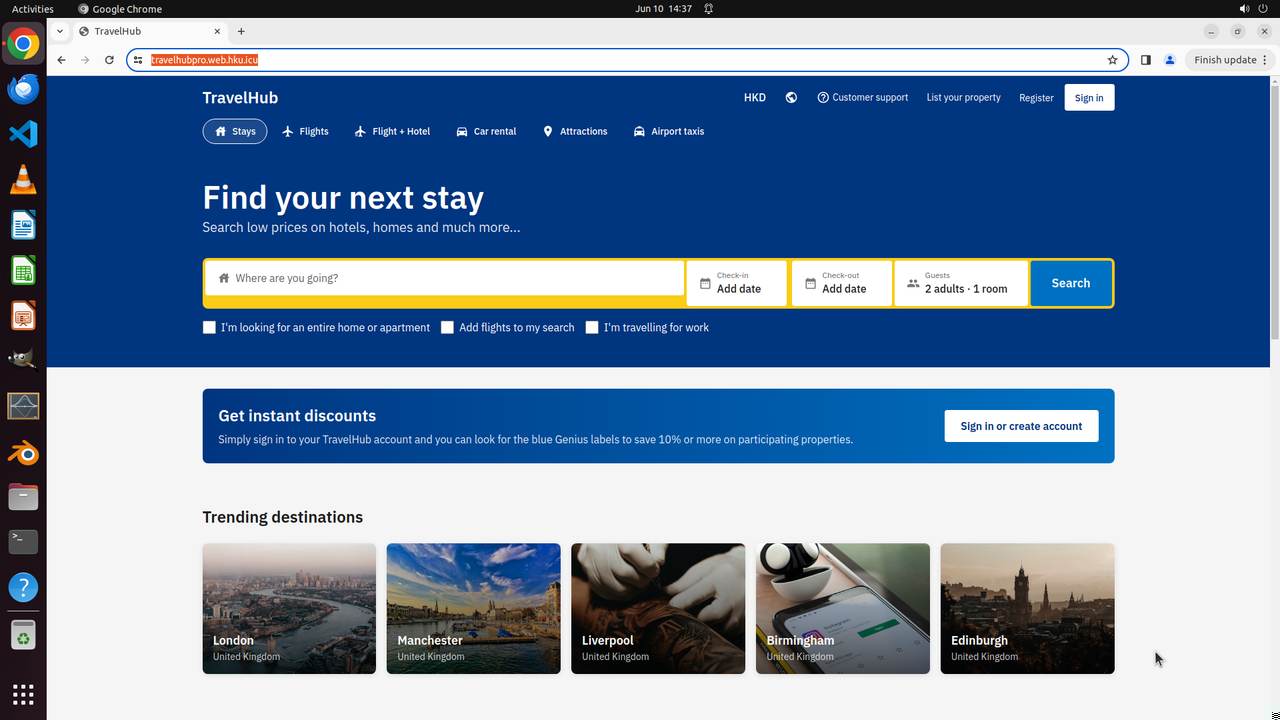
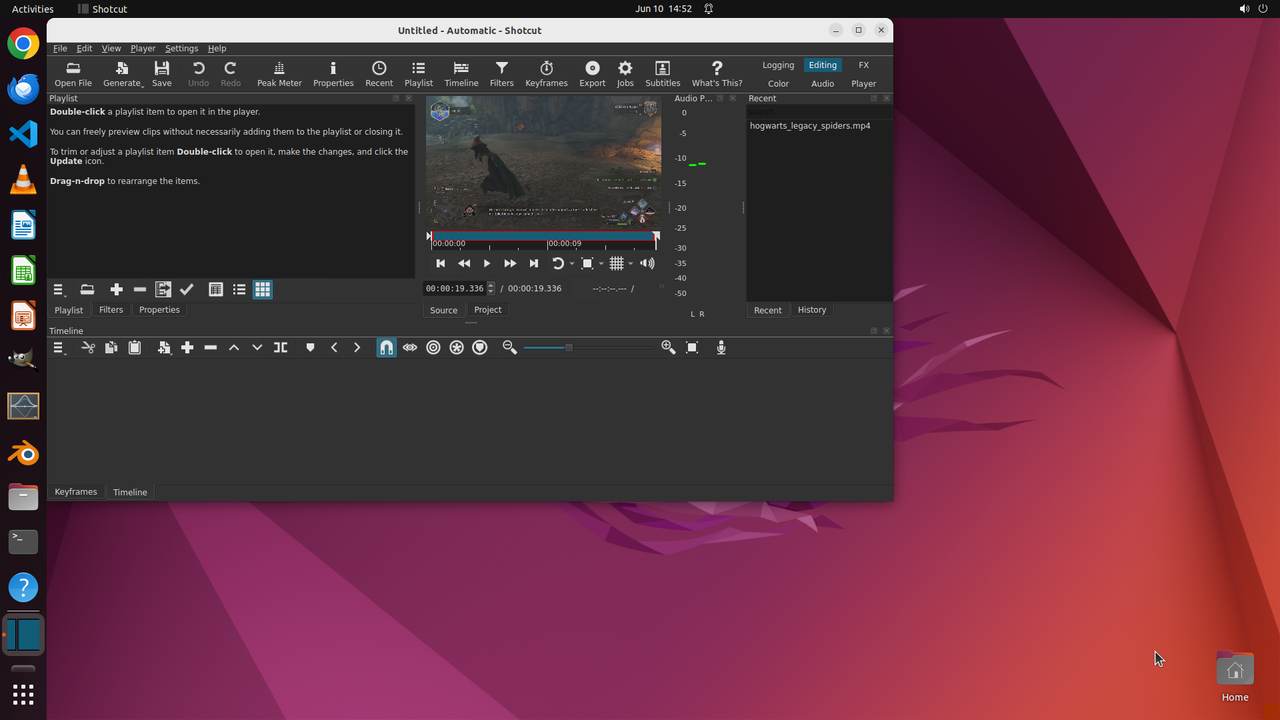
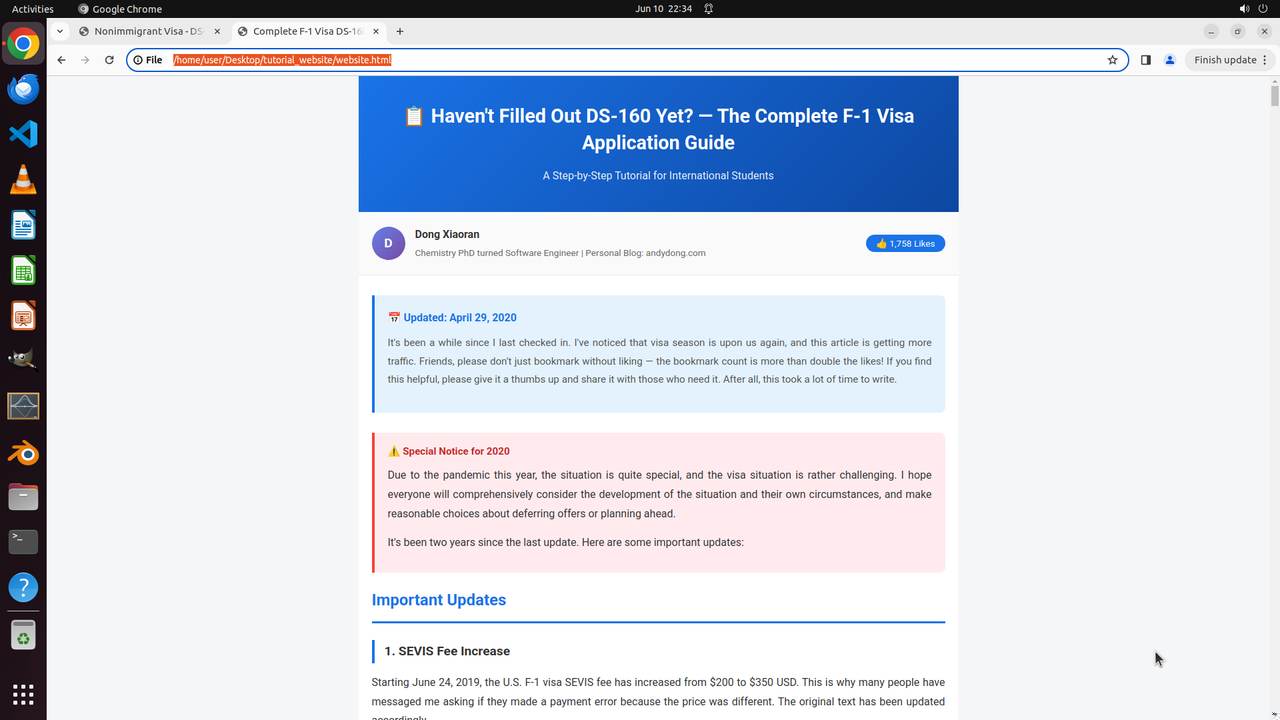
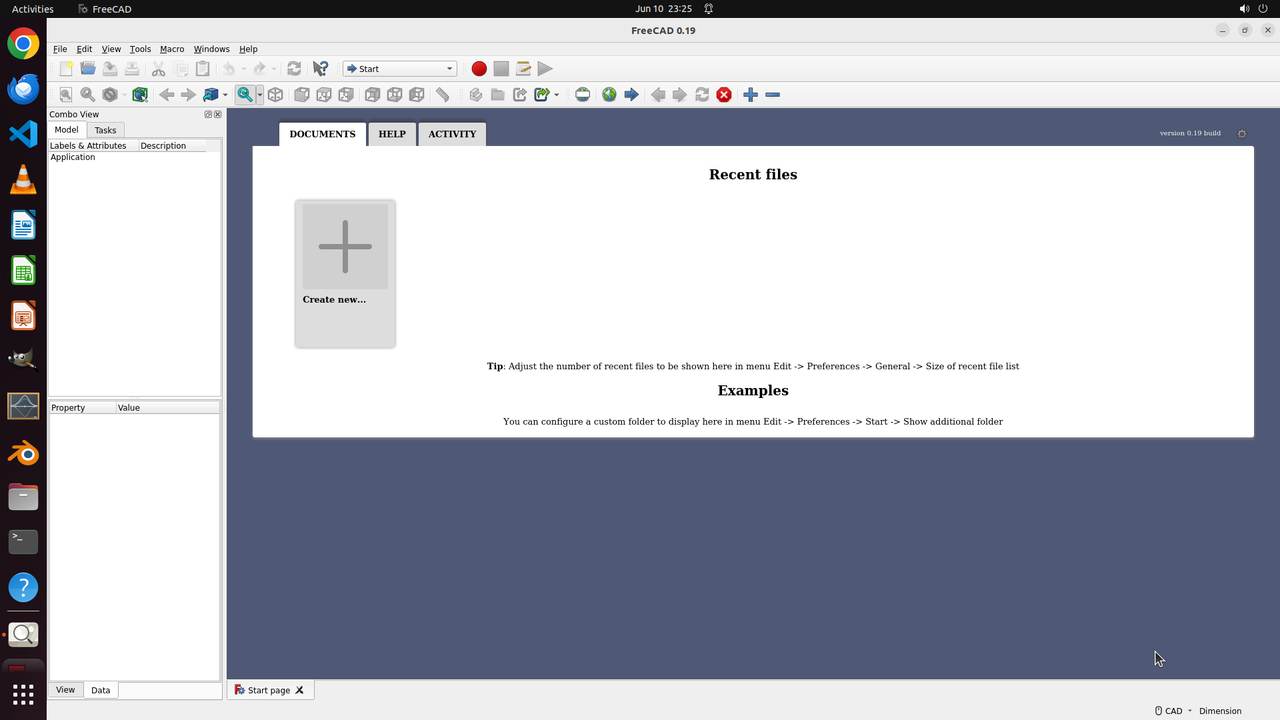
Inspect complete agent trajectories step by step. Explore all task trajectories.
OSWorld 1.0 vs 2.0
OSWorld 2.0 is a substantial expansion of the original OSWorld evaluation: tasks span far more agent steps, cross more applications, run inside reproducible self-hosted environments, and use partial credit instead of binary completion alone.
OSWorld 1.0
OSWorld 2.0
Methodology
Metrics
Submissions are scored at 150 / 300 / 500 agent-step budgets. The 500-step budget mirrors realistic long-horizon work; the 150-step budget surfaces efficiency.
Safety audit
A separate audit pipeline runs 8 diagnostic checks on each trajectory. Safety reports are scored independently from task completion.
What the results show
Three patterns recur across the evaluated agents.
Higher scores require disproportionately more tokens.
Crossing the 50% partial-score threshold requires order-of-magnitude more tokens than reaching 25%. Efficiency scales worse than capability.
Task horizon remains a hard limit.
Binary completion collapses as task length grows. On the longest workflows in the corpus, top frontier agents approach near-zero end-to-end completion regardless of step budget.
Agents are weak at recovering and maintaining hidden state.
When tasks require tracking unobserved or evolving context across steps, agents lose track — repeating earlier work, missing updates, or executing from stale plans.
Resources
Behind the benchmark
Computer-use agents are increasingly deployed on multi-hour professional workflows, but most benchmarks evaluate them on short desktop tasks that finish in under 30 steps. OSWorld 2.0 reframes the problem around long-horizon work, sourced from realistic end-to-end workflows that a skilled human typically takes over an hour to complete.
Acknowledgments
OSWorld 2.0 is developed by XLANG Lab, with contributions from Snorkel AI researchers Zhengyang Qi (Jason), Vincent Sunn Chen, and Frederic Sala. Snorkel AI is the research and data partner on this project.